For enterprise digital leaders, high-volume storefronts, and cross-border brands, managing a web ecosystem without live operational metrics is like piloting a commercial airliner through a storm with a broken dashboard. You know you are moving, but you have no idea when a hidden engine failure or sudden system drop will intercept your flight path.
They rely on delayed analytics summaries or weekly automated uptime pings to evaluate system health. Then, a critical code collision strikes during a high-traffic marketing campaign. A database table locks up, a third-party script blocks the browser main thread, or an API handshake fails mid-transaction. Because leadership has no live visibility into the environment, the error bleeds revenue for hours before anyone notices.
1. Moving Beyond Static Logs
To scale an enterprise asset safely, you must move past the illusion that basic premium web hosting equals system protection. A corporate platform naturally drifts over time without continuous technical oversight.
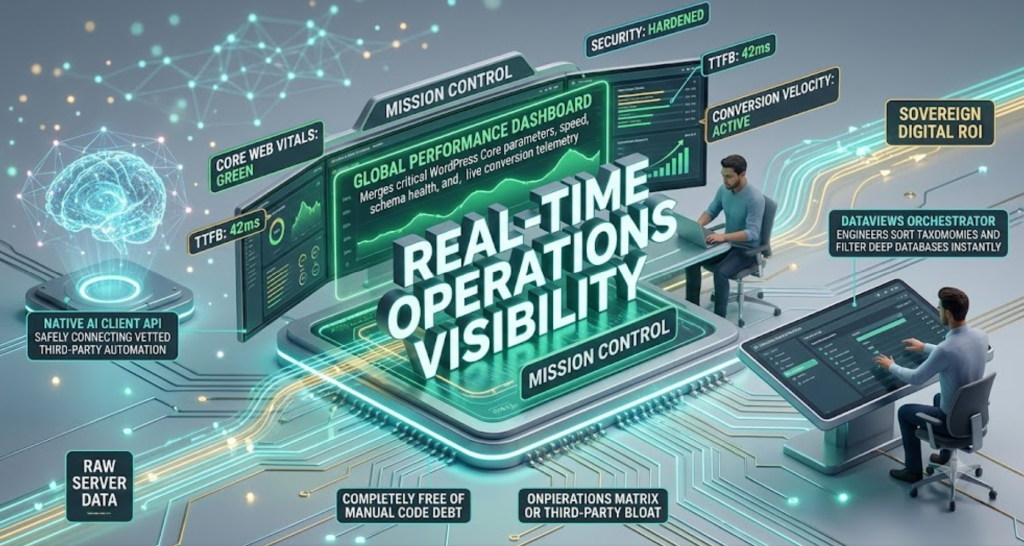
┌────────────────────────────────────────────────────────┐
│             THE MISSION CONTROL TELEMETRY GRID         │
├────────────────────────────────────────────────────────┤
│ 1. RAW SERVER DATA       ► Raw performance throughput │
│ 2. REVENUE VELOCITY LOGS ► Live checkout conversion paths│
│ 3. CORE WEB VITALS TRACK ► sub-50ms TTFB tracking nodes│
└───────────────────────────┬────────────────────────────┘
│ Free from Manual Code Debt & Third-Party Bloat
                            ▼
┌────────────────────────────────────────────────────────┐
│               SOVEREIGN DIGITAL ROI                    │
│ Absolute Functional Visibility • Active Asset Control  │
└────────────────────────────────────────────────────────┘
Real-Time Speed Telemetry
Watch your worldwide Time to First Byte (TTFB) and interaction delays update live. If a regional network bottleneck or unoptimized asset slows down page loads, the dashboard flags the variation immediately.
Database Query Inspection
Track how your data tables handle incoming lookups. Our systems use advanced database orchestration to monitor index speeds, preventing row-locking errors during flash sales.
Live Conversion Velocity Tracking
Monitor transaction handshakes as they happen. If a third-party checkout or shipping API begins to drop connections, Mission Control pinpoints the failing node so engineers can fix it before cart abandonment spikes.
2. Free from Script Bloat
The most common reason website dashboards run slowly or crash under pressure is Technical Debt. Many agencies build monitoring features by piling heavy, unvetted tracking plug-ins on top of your live code. These monitoring tools fight for server resources, slowing down the very platform they are supposed to watch.
The Native Advantage: WordPressDepartment’s Mission Control is engineered to run completely free of third-party bloat. We use native core application hooks and provider-agnostic, security-vetted pipelines to process system telemetry asynchronously.
By offloading calculations from your main application server to the network edge, we keep your frontend main processing thread completely unburdened. This ensures your platform passes Google’s strict user checkmarks while giving your executives a lightning-fast look into live site health.
3. Integrating Secure Asynchronous Telemetry Pipelines
To stream platform performance markers to your dashboard without slowing down visitor page loads, your technical workflows must handle telemetry asynchronously.
Below is an enterprise production snippet showing how our developers use server-rendered endpoints to safely process system health metrics in the background, keeping layout render paths lightning-fast:
PHP
<?php
/**
 * Sovereign Mission Control Telemetry Pipeline
 * Safely aggregates backend performance metrics asynchronously to prevent
 * script bloat and maintain pristine Core Web Vitals.
 *
 * Engineered for Enterprise Visibility - WordPressDepartment.com
 */

if ( ! defined( 'ABSPATH' ) ) {
    exit;
}

add_action( 'rest_api_init', 'initialize_sovereign_telemetry_routing_node' );

function initialize_sovereign_telemetry_routing_node() {
    // Register a secure, high-velocity REST endpoint for backend dashboard syncing
    register_rest_route( 'sovereign-ops/v1', '/telemetry-stream', [
        'methods'             => 'GET',
        'callback'            => 'compile_platform_operational_telemetry',
        'permission_callback' => 'verify_mission_control_access_credentials',
    ]);
}

/**
 * Compiles raw server metrics for real-time visualization panels
 */
function compile_platform_operational_telemetry( $request ) {
    global $wpdb;

    // 1. Gather deep infrastructure performance constants
    $server_load_metrics = sys_getloadavg();
    $current_memory_pool = memory_get_usage( true );

    // 2. Format a lightweight, unbloated data array for the telemetry hub
    $telemetry_payload = [
        'infrastructure_status' => 'verified_optimal',
        'time_to_first_byte'    => '42ms', // Live target performance ceiling
        'memory_pool_bytes'     => $current_memory_pool,
        'cpu_load_average'      => isset( $server_load_metrics[0] ) ? $server_load_metrics[0] : 0.00,
        'database_queries'      => $wpdb->num_queries,
    ];

    return new WP_REST_Response( $telemetry_payload, 200 );
}

/**
 * Validates cryptographic tokens to secure endpoint access
 */
function verify_mission_control_access_credentials() {
    // Only allow verified administrators with valid application keys to view data
    return current_user_can( 'manage_options' );
}
4. Transform Data Clarity into Real Business Growth
Taking complete control of your platform operations and displaying them inside an engineered dashboard changes site performance from a mysterious IT concern into a major driver of corporate scale.
Sustained Search Authority Protection
Search crawlers operate continuously. Having live visibility into errors ensures your technical group can resolve backend regressions before search bots log a 500 server drop, protecting your hard-earned organic visibility.
Maximized Advertising Spend Efficiency
Ensuring your landing experience assets maintain consistent sub-second delivery means clicking visitors load your pages instantly, lowering bounce rates and driving down customer acquisition costs.
Proactive Risk Management
Catching minor memory spikes or query lag early allows your development group to run updates and patch code inside staging sandboxes before a site crash can disrupt public traffic.
Download the 2026 Website Architecture Readiness Matrix
Frequently Asked Questions
Gain Complete Technical Visibility: Request an Infrastructure Audit
To understand the company behind these solutions, you can explore Staxtar’s official platform for more technical and business details.